
Why Your Best-Selling Shopify Product Might Be Your Least Profitable
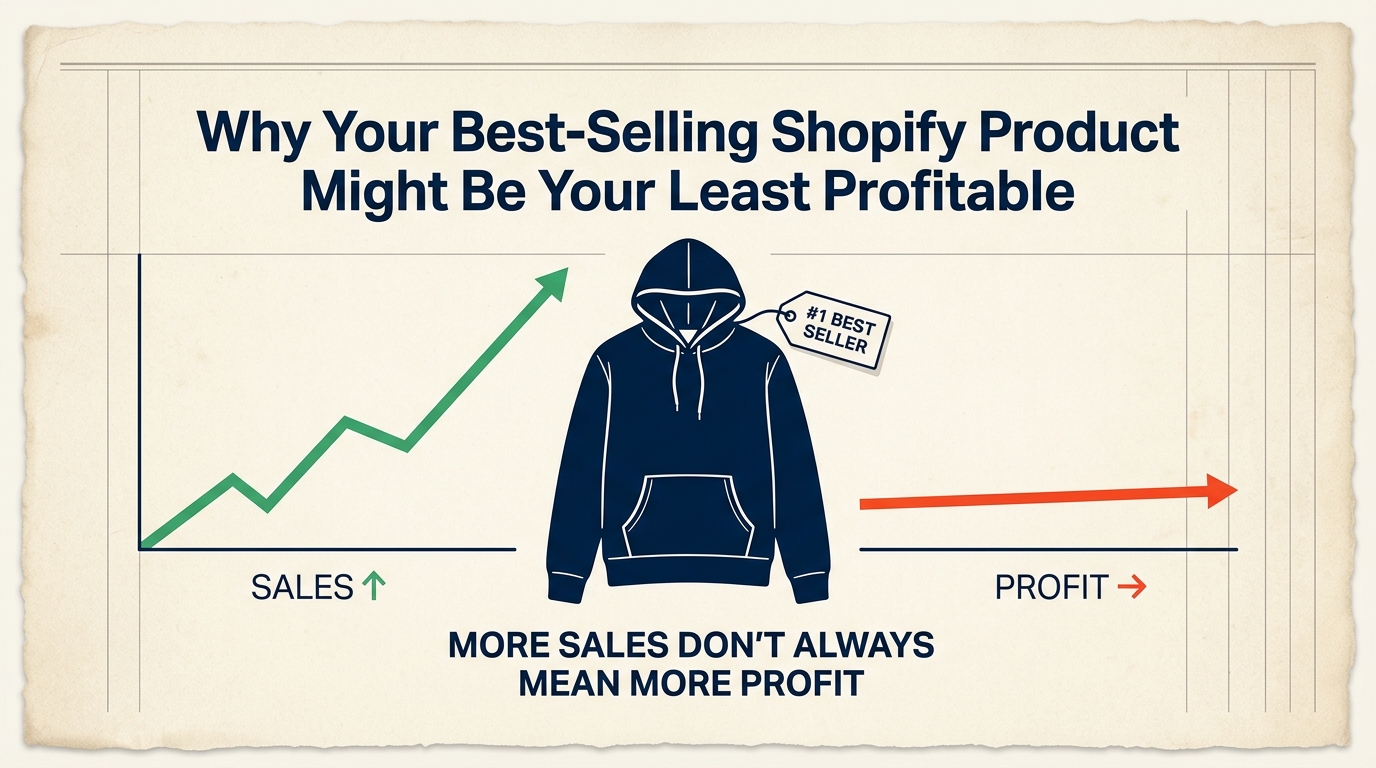
There’s a specific feeling that comes with watching a product take off.
The order notifications start stacking up faster than you can read them. The inventory dashboard shows a SKU sliding toward zero, and instead of dread, you feel something closer to pride. Customers are tagging you in reviews. Someone on the team screenshots the sales chart and drops it in Slack with a fire emoji.
For the first time in a while, it feels like the business is working.
This is usually the moment a founder stops asking hard questions about a product.
It’s also, often, the exact moment she should start.
The Product Everyone Believes Is Carrying the Company
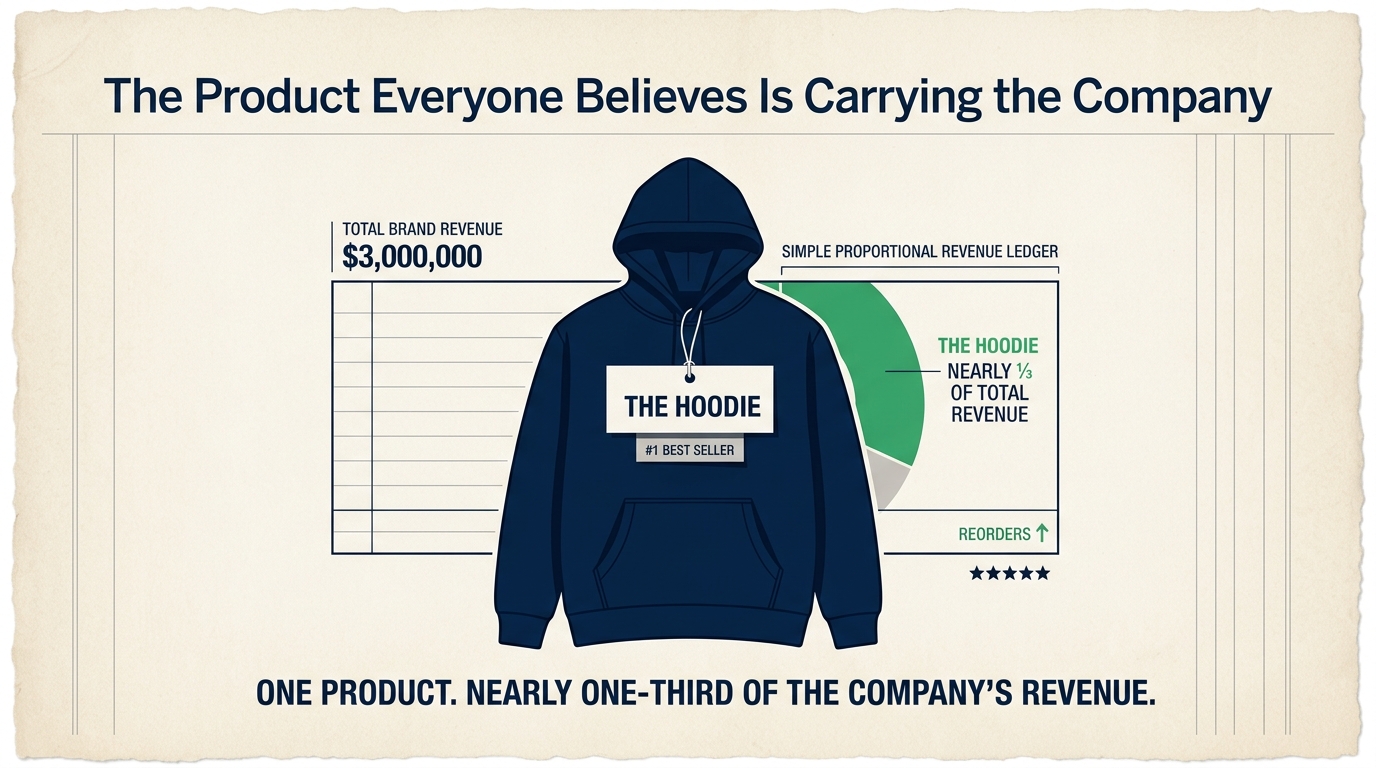
Picture a founder running a $3 million Shopify apparel brand.
She launched a heavyweight hoodie eighteen months ago, mostly as a seasonal add-on — something to round out a fall collection, nothing more.
It became something else entirely.
It’s now nearly a third of total revenue. It shows up in almost every marketing email, every paid ad set, every “best sellers” collection on the site. Internally, everyone just calls it the hoodie, the way a restaurant refers to its signature dish without needing to say the full name out loud.
By every visible measure, the hoodie is a triumph.
Sales are up. Reorders are constant. The reviews are glowing. When she opens her Shopify dashboard, gross sales for the hoodie sit at the top of the page, bold and unmissable, and the “Cost per item” field shows a healthy markup underneath it.
If you asked her which product was the backbone of her business, she wouldn’t hesitate.
She wouldn’t even have to check.
Something Doesn't Feel Right
A few months into the hoodie’s run, something starts to nag at her. Not a number, exactly. More like a mood.
Revenue is at an all-time high. The bank balance is not.
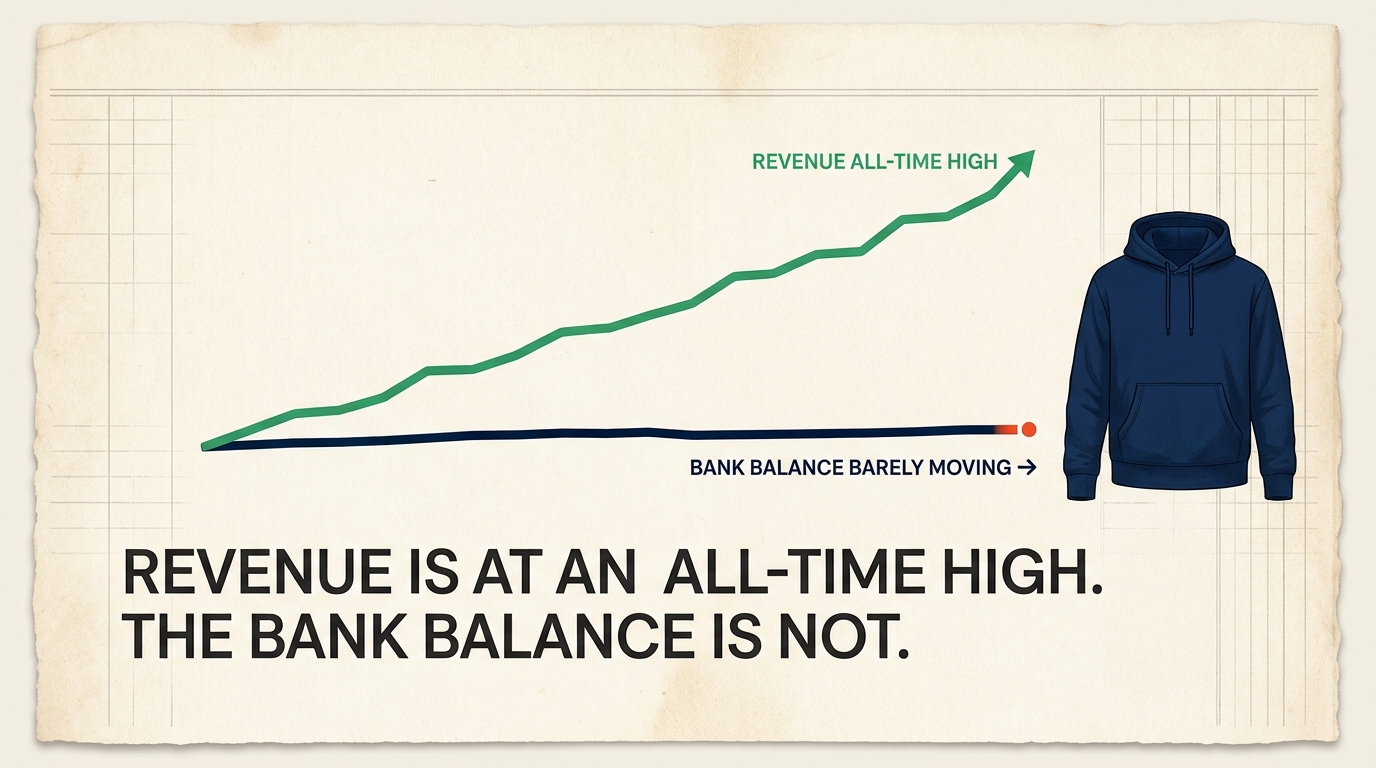
At first, she brushes it off. Maybe this month is just unusual. She’s paying a supplier a little earlier than normal. She just placed a bigger inventory order than usual. There’s always an explanation, and for a while, each one is plausible enough to file away and forget.
But the feeling doesn’t go away.
It just changes shape.
She’s reordering inventory more frequently, and each purchase order feels a little tighter than the last one. Her ad account needs more spend to hit the same order volume it hit a quarter ago. Maybe Meta’s just gotten more expensive for everyone, she tells herself, and moves on. Payroll doesn’t feel any easier to make than it did when revenue was 20% lower — which doesn’t seem right, because revenue is supposed to be the thing that makes payroll feel easier.
So she starts checking the bank balance more than she’d like to admit.
Not because anything is on fire. Because something isn’t adding up, and she can’t yet say what.
When her bookkeeper sends the monthly P&L, she finds herself scrolling straight to the “net profit” line before reading anything else — the way you check a scale before you check how your clothes fit. It keeps landing smaller than she expects.
We’re selling more than we ever have, she thinks. So why doesn’t it feel that way?
This is the moment most Shopify founders eventually hit, usually somewhere between $500,000 and a few million dollars in revenue. It rarely arrives as a crisis. It arrives as a low hum of discomfort that’s hard to justify out loud, because every number she can easily see is telling her the opposite story.
Revenue and profit are two different stories. They’re told to use two different sets of numbers.
Most Shopify dashboards are only fluent in one of them.
To find the other story, she has to go looking.
The First Hidden Cost
Ask most founders what their product costs, and they’ll give you the number from the supplier invoice without blinking.
For the hoodie, that number is $20.
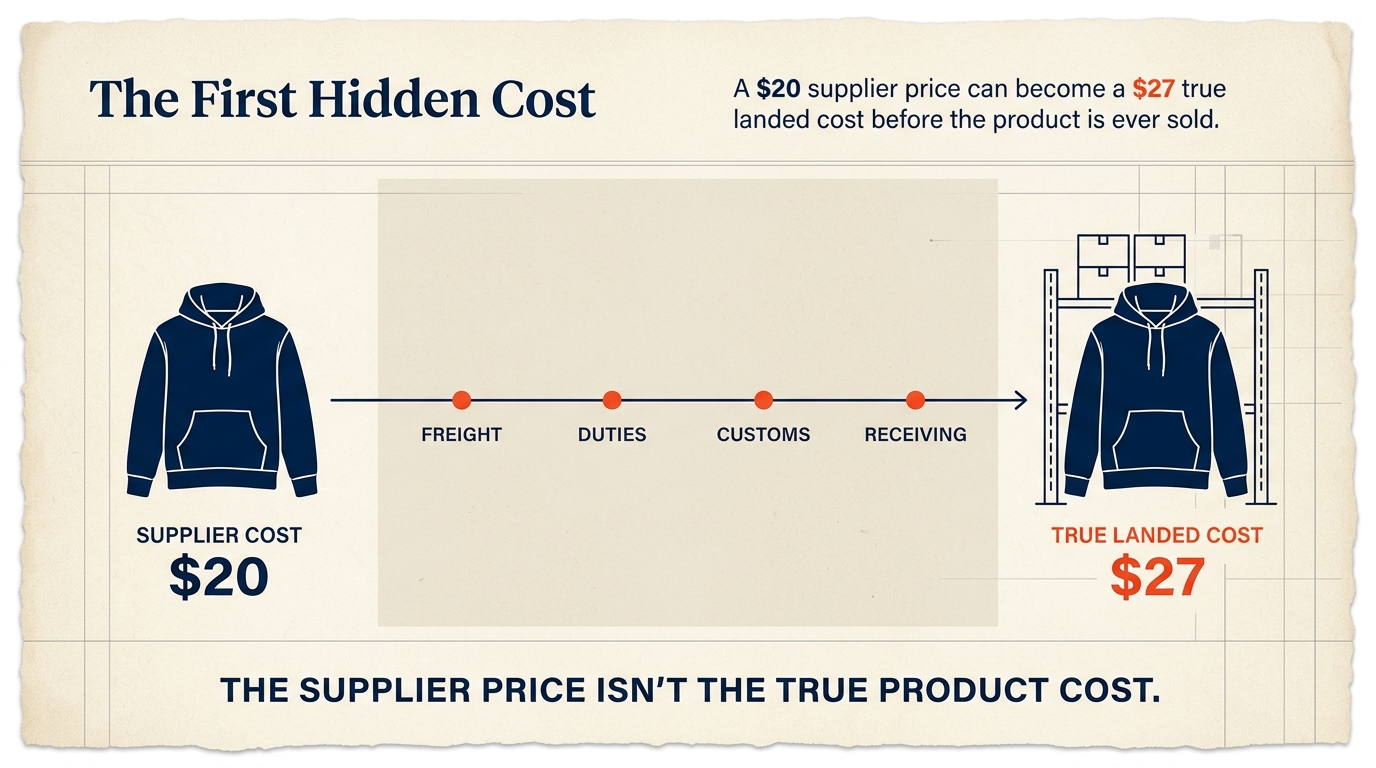
It’s the number that’s been sitting in the “Cost per item” field since the day the product launched. Every markup calculation in the business has been quietly built on top of it for eighteen months, without anyone revisiting it.
She assumes it’s still accurate. Why wouldn’t it be? Nothing about the hoodie has changed. Same factory. Same fabric. Same fit.
It is also, in a strict and important sense, wrong.
Twenty dollars is what the factory charges to make the hoodie. It has nothing to do with what it costs to get that hoodie from a factory floor in Asia into a customer’s closet in Ohio. Between those two points sits a chain of costs that never shows up on a supplier invoice — and in the 2025–2026 sourcing environment, that chain has gotten considerably more expensive than it used to be, whether she noticed or not.
Inbound freight to get it to a US port. Customs clearance. Duties. Insurance. The labor to receive and shelve it once it lands.
Each of those, on its own, is almost too small to argue about.
Stacked together, they’re not.
Here’s what she hasn’t priced in, because it happened quietly, in the background, while she was busy running a business: in May 2025, the United States suspended the “de minimis” exemption — the rule that had let shipments under $800 clear customs duty-free — for goods from China and Hong Kong. By that August, the exemption was gone globally. Section 301 tariffs on Chinese-made goods now sit somewhere between 20% and 30%, depending on the category.
A founder sourcing from China who hasn’t touched her landed-cost model since before May 2025 is very likely pricing off a number that no longer exists.
Run the math, and a $12 item that used to clear customs for free can now carry $2.40 to $3.60 in duties alone. No change in the factory price. No change in the product. No change in sales volume.
Just a policy shift, thousands of miles away, that quietly moved the floor under her margin.
Advisors who work with import-heavy Shopify brands have watched this play out in real time. Companies that rebuilt their landed-cost model within 90 days of the 2025 changes preserved roughly 85% of their pre-tariff contribution margin. Companies that waited six months or longer absorbed a permanent 8-to-15-percentage-point hole in their margins — a hole that no amount of sales volume can fill, because it’s baked into every unit sold, forever, until someone finally rebuilds the math.
So the $20 hoodie was never really a $20 hoodie.
Once freight, duties, customs handling, and receiving are folded in, it’s closer to $27.
Nobody updated the spreadsheet. Nobody was supposed to, exactly — that’s not how spreadsheets work. They only tell you what someone typed into them.
And the easiest number to find is rarely the truest one.
The Costs That Never Get a Line of Their Own
That’s the first leak. It’s also, unfortunately, the smallest one.
Here’s where the story stops being an accounting puzzle and starts feeling like a slow leak in a tire — the kind you don’t notice until you’re already stranded on the shoulder, wondering how long it’s been going on.
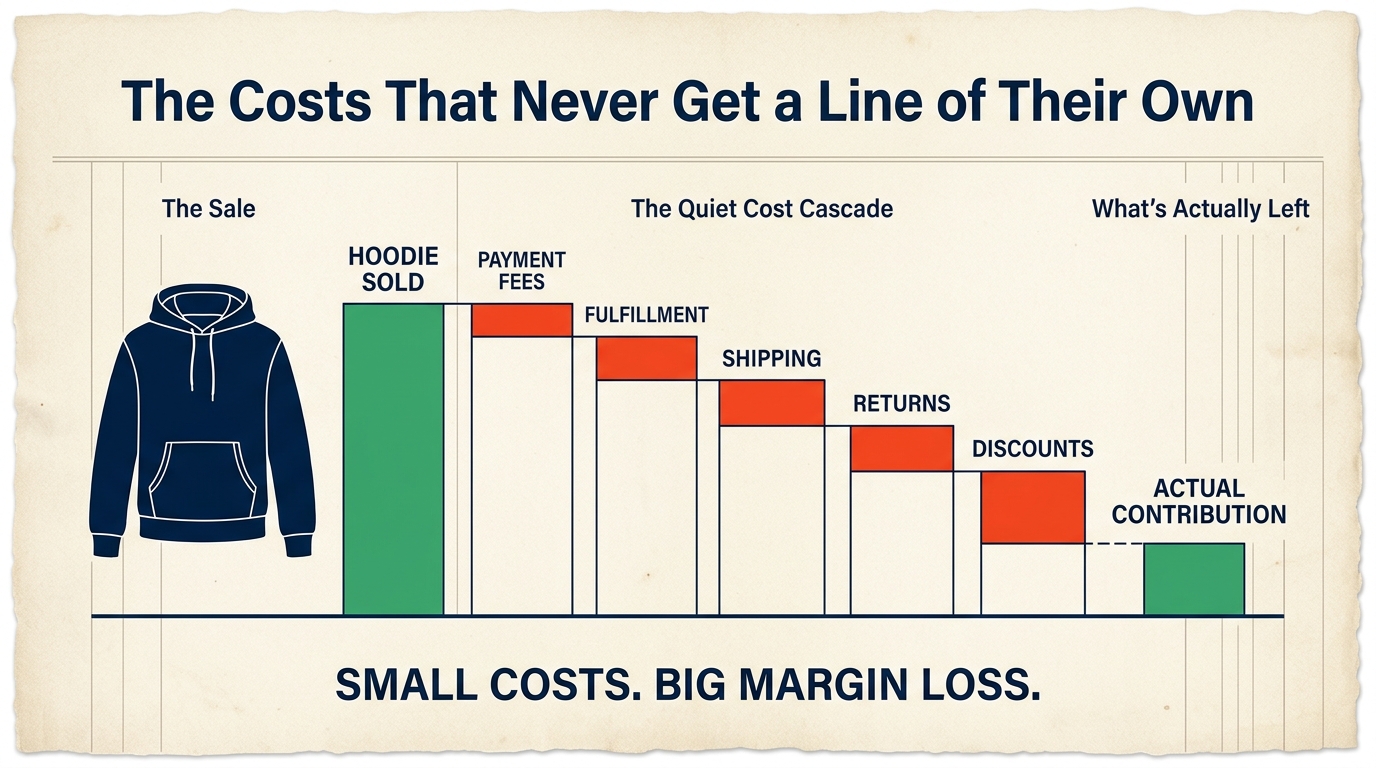
Every time the hoodie sells, it doesn’t just cost $27 to have made. It triggers a small cascade of charges, and none of them show up next to the product in any Shopify report, because none of them were ever designed to be tracked at the product level.
Start with the money that moves before a shipping confirmation is even sent. Shopify Payments takes somewhere between 2.4% and 2.9% of the sale, plus 30 cents, depending on her plan. If a customer checks out with a third-party gateway instead, there’s an additional surcharge stacked on top of whatever that gateway already charges — a detail buried deep enough in Shopify’s fee structure that most founders don’t discover it until they’re staring at a reconciliation report, wondering where a few percentage points went.
Then there’s Buy Now, Pay Later.
Roughly one in seven American adults has used it in the past year, according to Federal Reserve survey data, and the hoodie — priced high enough to feel like a real purchase — is exactly the kind of product BNPL gets used on. Shop Pay Installments, Shopify’s own option, is effectively free on top of standard processing. Afterpay, Klarna, and Affirm are not. They typically run 4% to 6.5% of the transaction. On a $200 order, that’s eight to thirteen dollars gone at checkout, on a product that already looked “profitable” the moment it left the warehouse.
Someone has to pick the hoodie, pack it, and ship it. All-in fulfillment for a typical DTC brand runs somewhere between seven and eighteen dollars an order — and heavier, bulkier products tend to sit at the expensive end, because carriers price by dimensional weight, not by what’s actually inside the box. A hoodie shipped in a slightly oversized mailer can quietly cost more to ship than it cost to make.
And then there are returns.
This is where the real damage tends to live.
The average ecommerce return rate is sitting around 19% to 21% heading through 2026, according to National Retail Federation data. Apparel runs well above that average, often 20% to 40%. A hoodie with any sizing variability is close to a perfect candidate: exactly the kind of product a customer orders in two sizes, intending to keep one and send the other back.
Each of those returns costs somewhere between ten and sixty-five dollars to process, once you count return shipping, inspection, and restocking. And here’s the detail that’s easy to forget: nearly half of all returned inventory never sells at full price again. Some of it gets discounted. Some of it gets written off completely.
None of this even touches chargebacks, which cost merchants roughly $110 to $128 all-in once you account for the lost product, the lost acquisition cost, and the dispute itself — not the $15 fee that shows up on the statement, but the real number underneath it. Or customer service time. Or the discount code that quietly shaved another 15% or 20% off a given sale.
Individually, every one of these costs looks negligible.
That’s exactly what makes them dangerous.
There’s a version of this that’s even easier to miss, because it happens at checkout instead of in a shipping bay. Her promotional calendar looks fairly standard: a 10% welcome code for new subscribers, a 10% abandoned-cart email, free shipping over $75. None of it looks aggressive on its own. But a customer who joins the list, abandons a cart once, and gets nudged back with an email can stack two discounts on a single order without anyone intending it. Add free shipping on top, and an order that looked like it was giving away 10% was actually giving away closer to 30%. Nothing in Shopify’s checkout stops those discounts from combining unless a merchant deliberately builds in a rule against it — and most don’t, because it’s not the kind of problem that announces itself. It just shows up, months later, as a gap between the discount rate she thinks she’s running and the one her order data actually reflects.
No single cost is big enough to notice.
Together, they’re big enough to erase the profit she thought she had.
The Quiet Performer Nobody Talks About
It helps, at this point, to put a second product next to the hoodie. If only to see how differently the same store behaves depending on what it’s selling.
Alongside the hoodie, the brand also sells a simple cotton cap. Cheaper to make. Cheaper to ship. Rarely returned. Never once the star of a marketing campaign.
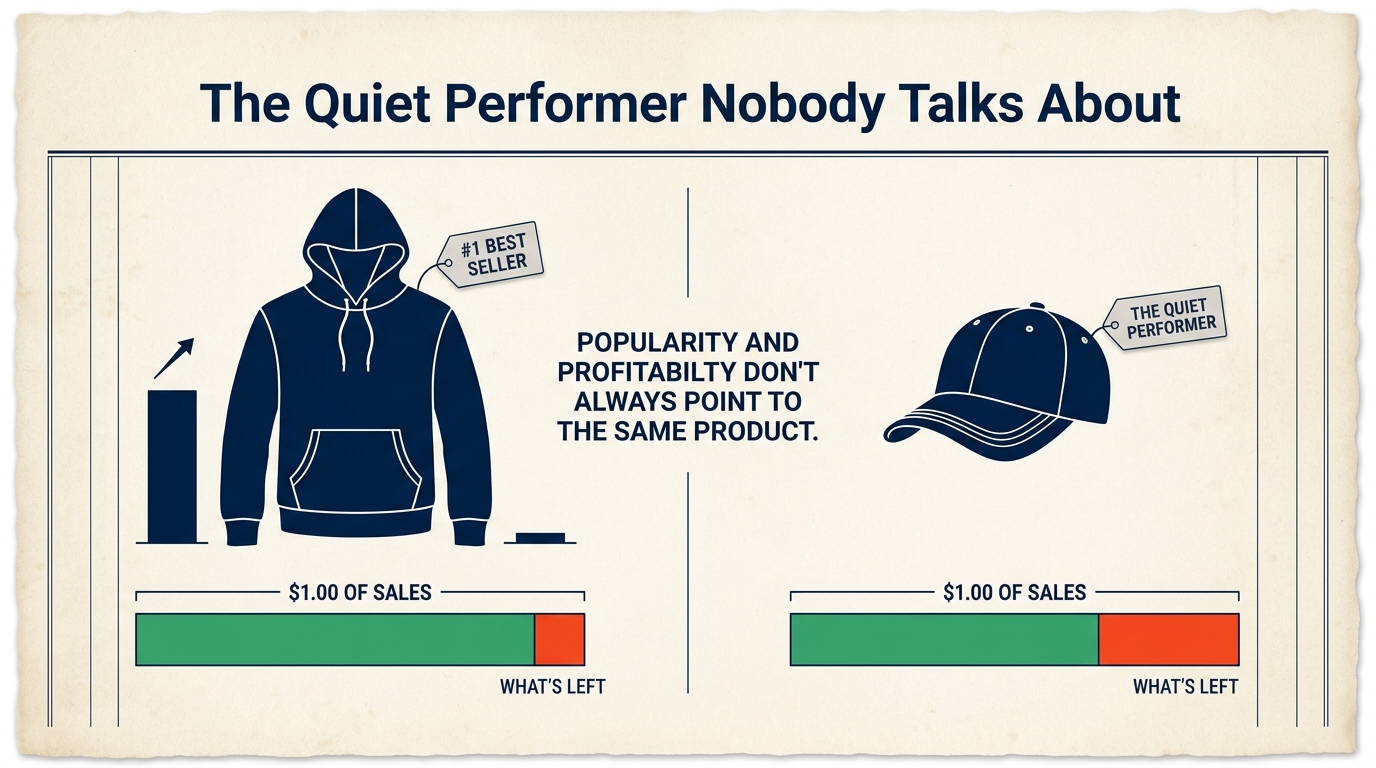
Nobody on the team has ever screenshotted the cap’s sales chart.
Run it through the same landed-cost and contribution-margin math as the hoodie, though, and it tells a completely different story. A lighter item, shipped in a standard envelope instead of an oversized box. A return rate closer to single digits, instead of apparel’s usual 20%-plus. Never bundled into a payment plan that adds a merchant fee on top of standard processing.
Dollar for dollar, a much larger share of what the cap sells for actually survives the trip to the bank account.
This isn’t an argument for abandoning the hoodie and pushing hats instead. It’s proof of something that’s easy to say and hard to actually feel until you’ve watched it happen inside your own numbers: a company’s attention and its actual profitability don’t automatically point at the same product. Somewhere in most catalogs sits a quiet, unglamorous performer doing more for the bank account per unit than the product getting all the ad spend and all the applause.
The Cruelest Twist
Here’s the part of the story that catches most founders off guard, because it runs against every instinct built up in the early days of the business, when more sales reliably meant more money.
The hoodie’s popularity isn’t neutral.
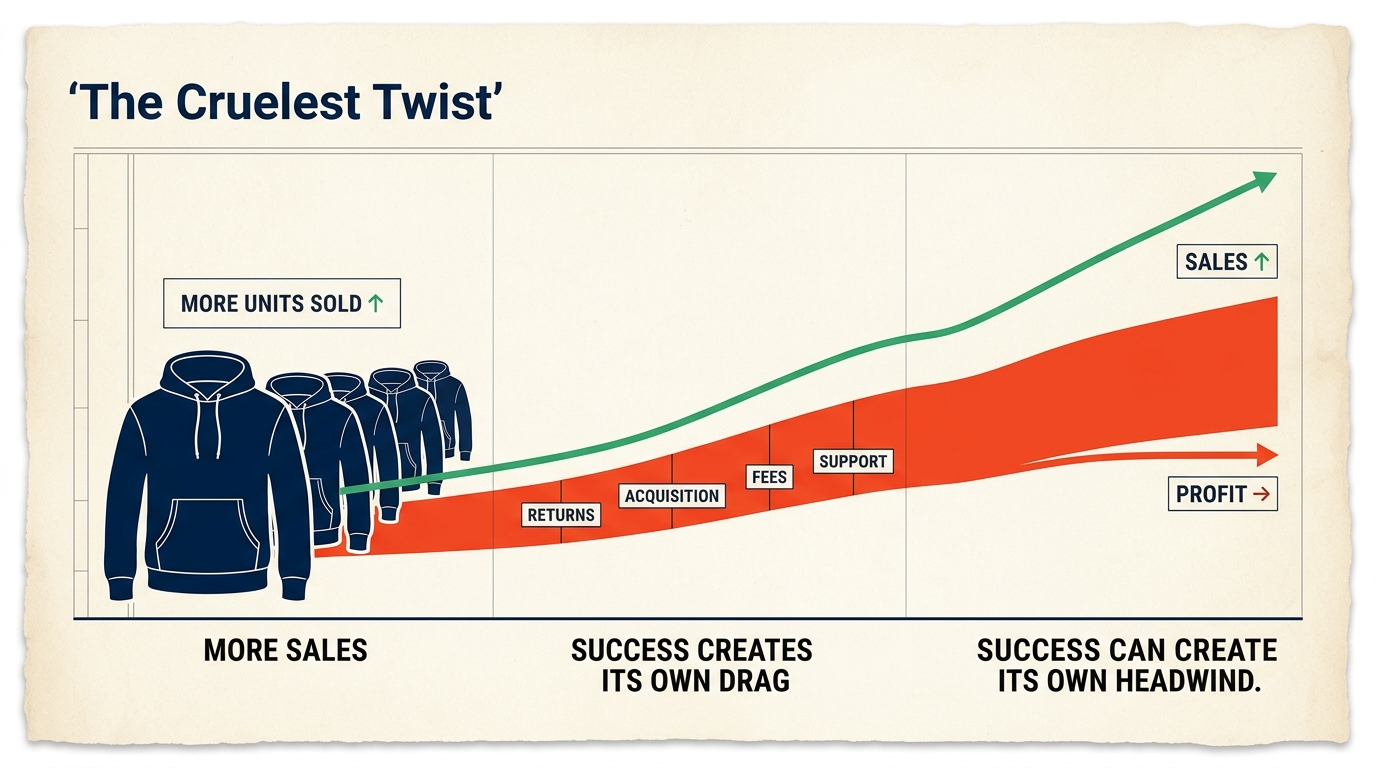
It isn’t simply generating more revenue at the same profitability the product has always had. It’s actively working against the business, in almost exact proportion to how well it’s selling.
Every additional unit sold is another unit that can come back. Another shipment that can get damaged or delayed. Another payment that can be disputed. Another support ticket if the fit runs small. Another dollar of ad spend required to keep replicating the same sales volume, because the cheap, easy customers who found the product organically were the first ones to buy, and every customer acquired after them costs a little more than the one before.
That last part isn’t unique to her business. It’s playing out across the entire industry right now. Average customer acquisition cost in ecommerce has climbed roughly 40% to 60% over the past two years, driven by privacy changes, more competition for the same ad inventory, and platforms that keep raising prices in an auction that gets more crowded every quarter.
So the hoodie’s success creates its own headwind.
Revenue keeps climbing, because the top-line number only measures what came in the door. It has no mechanism for subtracting what walked back out: the returns, the chargebacks, the rising acquisition cost, the payment fees compounding on volume that’s growing faster than the underlying margin can support.
Profit has to absorb all of that.
On a product selling this many units, there’s a lot to absorb.
This is the part of the story where a founder starts to suspect something structural is going on. Not a bad month. Not one bloated expense. A pattern baked into the product itself.
And when she goes looking for proof, she does what almost every Shopify founder does first.
She opens the dashboard.
Why the Dashboard Won't Tell Her
The Shopify dashboard says the hoodie is doing great.
Revenue: strong. Gross profit: healthy. The “Profit by product” report shows a comfortable margin between what the hoodie sells for and what Shopify has on file as its cost.
Nothing in the interface is flashing red.
She stares at it for a while, the way you stare at a test result that contradicts how you feel, half-expecting a different number to appear if she refreshes the page.
Nothing changes.
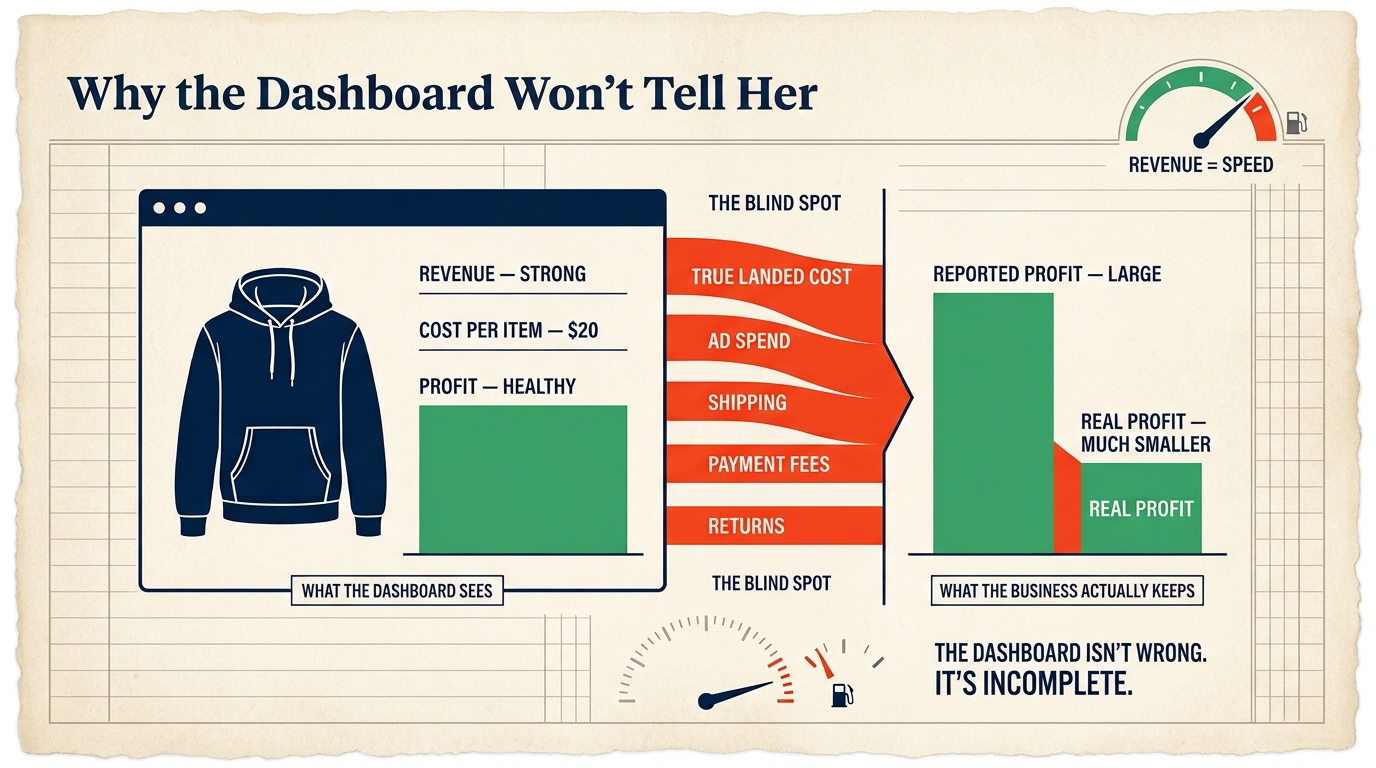
This isn’t Shopify lying to her. It’s Shopify answering a much narrower question than the one she’s actually asking.
The “Cost per item” field only ever knows what someone typed into it, and in most stores, that’s the original supplier cost, not the $27 landed cost the hoodie actually carries once freight and duties are counted. Beyond that, Shopify’s profit reporting was never built to include advertising spend from Meta or Google, third-party payment fees, third-party shipping costs, or the cost of the returns that keep coming back.
Analysts who’ve studied this gap closely have found that once those costs are properly layered in, a brand’s true net profit typically runs 30 to 50 percentage points below what Shopify’s own profit report shows.
That’s not a rounding error. That’s the difference between a product that looks like the backbone of the business and a product that might be quietly losing money on every unit sold.
It’s worth pausing here, because this isn’t a story about a badly run store or an inattentive founder. It’s a story about a tool built to do something specific — track sales, manage inventory, process payments — that was never asked to answer “what did this product actually earn the business, after everything.” No dashboard can subtract a cost it was never told about. The advertising spend lives in Meta’s ad manager. The BNPL fee lives in Affirm’s settlement report. The true landed cost lives in a freight invoice and a customs form, filed somewhere she’s never opened.
Shopify sees none of it.
Because none of it happens inside Shopify.
Revenue is the speedometer. It tells you how fast the business is moving, and it’s very good at that job. It just can’t tell you how much fuel is left in the tank, or whether the tank has a slow leak nobody’s patched yet.
The founder isn’t imagining the gap between “the hoodie looks profitable” and “cash isn’t growing.” She’s just been reading a gauge that was only ever built to answer half the question.
The Decisions That Followed From an Incomplete Answer
Here’s where an incomplete number stops being a reporting problem and starts being a business problem.
For the past year and a half, every major decision she made about the hoodie was built on the assumption that its Shopify-reported margin was its real margin.
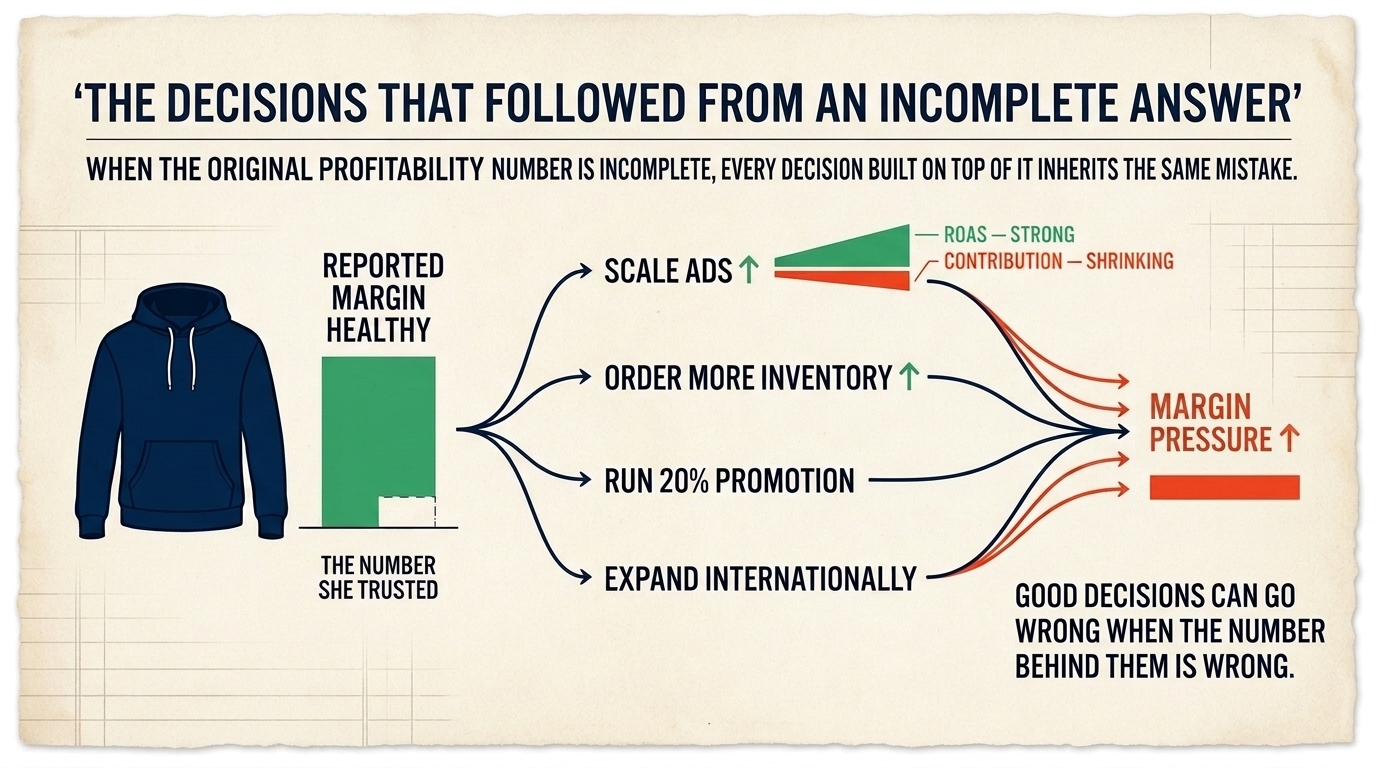
She scaled ad spend against it, because the return on ad spend looked strong and the product “obviously” made money on every sale.
She ordered inventory in larger batches to hit better supplier pricing, tying up cash in a SKU whose true per-unit economics she’d never actually verified.
She ran a 20% site-wide promotion during a slow week, reasoning that the hoodie had plenty of margin to give away. What she didn’t realize is that a 20% discount on a product with a 50% gross margin doesn’t just cost 20%. It cuts the margin itself by roughly a quarter, because the discount comes straight off the top while the cost of goods, the shipping, and the payment fees all stay exactly where they were.
She added Shop Pay Installments and watched average order value climb, and treated that climb as a straightforward win, without separating how much of it was genuine profit growth from customers simply spending more because the payment felt smaller.
None of these were reckless decisions.
They were the correct decisions, if the number she was working from had been accurate.
That’s what makes bad profitability data so much more dangerous than bad sales data. A founder who doesn’t know her sales are down will find out fast; the bank account tells her, loudly, within a month. A founder who doesn’t know her best-seller is thin-margin can keep making confident, well-reasoned, textbook-correct decisions for a year and a half. And every one of them will make the underlying problem slightly worse, because every one of them assumes a margin that isn’t really there.
The advertising decision deserves a closer look, because it’s the one that compounds fastest.
Every week, she checks her ad account. Every week, the number staring back is ROAS — return on ad spend, revenue divided by what she spent to generate it. On the hoodie, that number has looked strong for months, and a strong ROAS feels like permission to spend more.
But ROAS is a revenue metric wearing a profitability costume. It has no idea what the hoodie actually costs to make, ship, or process. It has no idea how often it comes back. A campaign can post an excellent ROAS on a product with almost no contribution margin left to give — which means she could be increasing ad spend at the exact rate the hoodie’s true profitability is shrinking, and the dashboard she’s watching would never tell her, because it isn’t built to.
She almost made the same mistake a second time, in a different direction, when a wholesale buyer in the UK reached out about carrying the hoodie internationally.
On paper, it looked like free growth. Existing product. Existing demand signal. New market.
What she hadn’t priced in were the costs that only appear once a product crosses a border: currency conversion fees on the settlement, a higher processing rate on international cards, the duties and tax handling that come with cross-border fulfillment. None of those costs are large individually. Together, they’re large enough that a product with a thin domestic contribution margin can turn negative the moment it’s sold internationally, at the exact same retail price, to the exact same kind of customer.
She caught it before signing the deal. Mostly by accident, while pulling numbers for an unrelated conversation with her accountant.
That near-miss is what finally pushed the question from background noise into something she couldn’t put off any longer.
What does this product actually create, she found herself asking, after everything it costs to sell it?
That question has an answer.
It’s just not one Shopify was built to give her by default.
The Metric That Changes Everything
The answer is contribution margin.
It’s worth being precise about what that phrase actually means, because it isn’t another accounting abstraction sitting next to gross margin and net margin, competing for her attention. It’s the answer to the exact question she’s been circling this whole time.
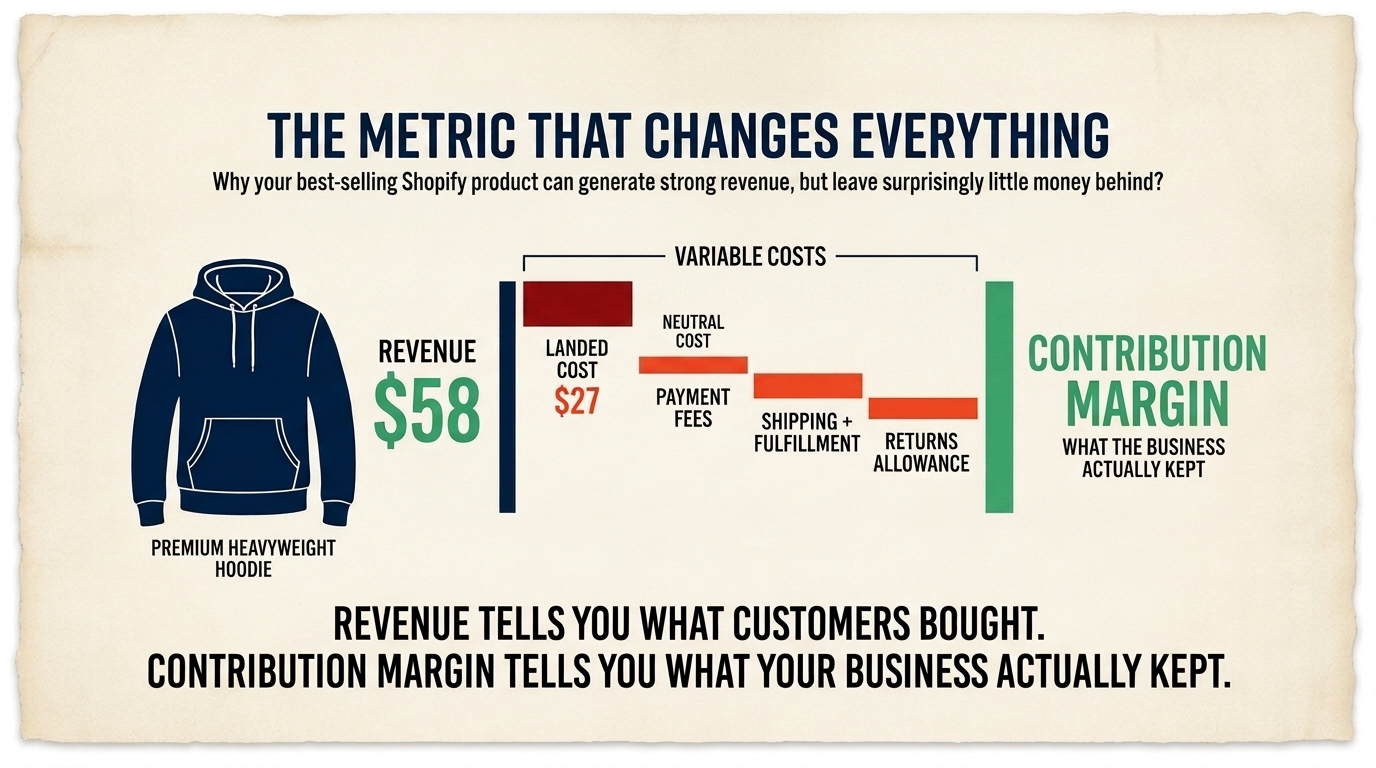
Contribution margin asks a simple thing: after every cost that scales with this specific sale — the true landed cost, the payment fee, the shipping, the fulfillment labor, a fair allowance for returns — how much money is actually left?
Not left on paper.
Left in the business.
Run the hoodie through that lens, and the story changes. Selling for $58 with a $27 landed cost, it carries a respectable-looking gross margin of roughly 53%. But once the payment processing fee, the outbound shipping and fulfillment cost, and a reasonable allocation for apparel’s return rate are subtracted — somewhere in the range of $12 to $18, depending on how it ships and how often it comes back — what’s actually left to fund advertising and cover overhead can shrink to the high teens or low twenties as a percentage of revenue.
That’s before a single ad dollar has been spent acquiring the customer in the first place.
Analysts who track DTC unit economics generally consider a contribution margin above 20-25% of revenue healthy for a product business, and below 15% a signal that something in the cost structure needs to change before the product gets scaled any further.
This is the number that would have told her, eighteen months ago, whether the hoodie could actually support the ad spend she was pouring into it. It’s the number that would have flagged, the moment landed cost jumped after the 2025 tariff changes, that pricing needed to move. It’s the number that separates a product that sells a lot from a product that makes money, which, it turns out, are not the same claim, even though it’s easy to spend years assuming they are.
Revenue tells you what customers bought.
Contribution margin tells you what your business actually kept.
That’s the line worth remembering, the one that’s easy to forget in the middle of a record sales month.
How Sophisticated Shopify Brands Actually Evaluate a Product
Once a founder sees this, she can’t unsee it.
The mental model for evaluating every product in the catalog starts to shift, quietly, in the background, the way any real change in judgment does.
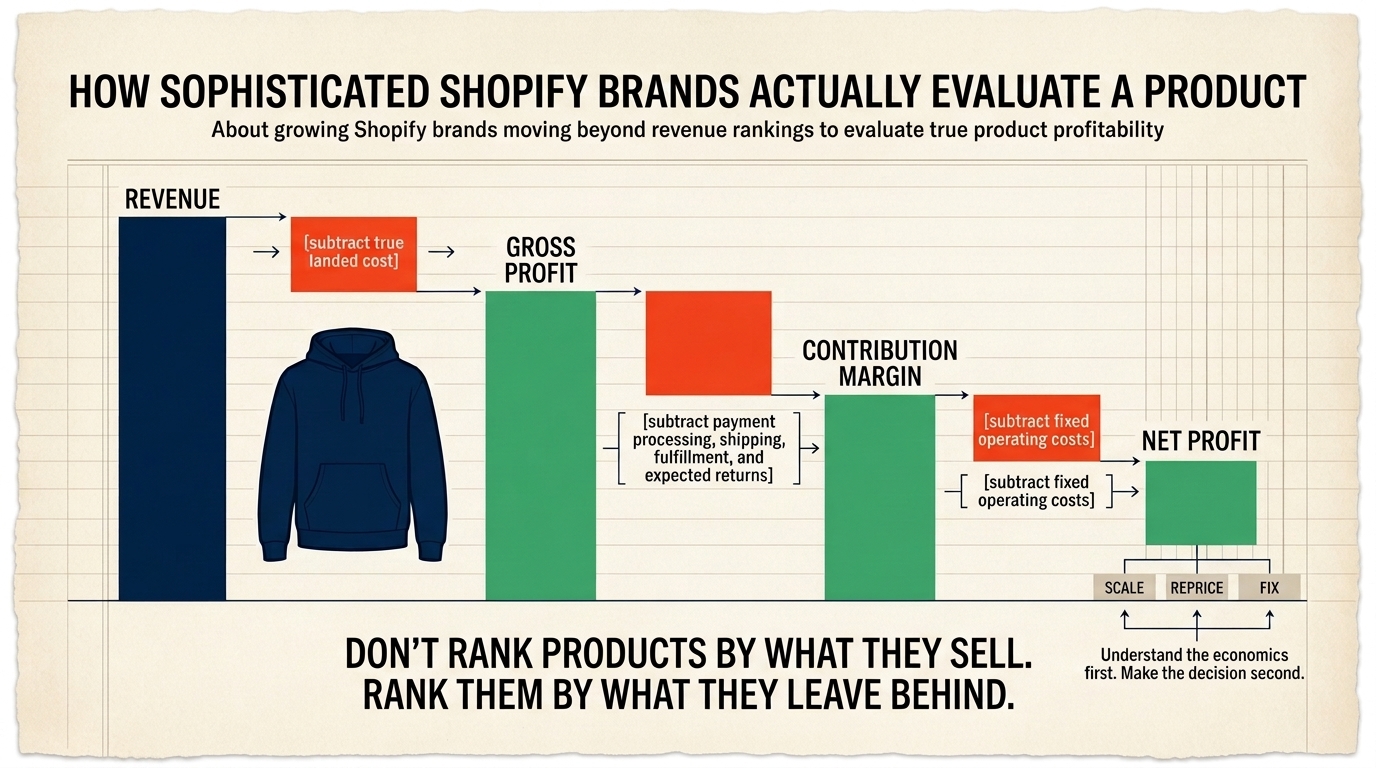
Instead of asking how much a product sold for, the question becomes a sequence, each layer stripping away another cost until what’s left is unambiguous. Revenue first. Then gross profit, once the true landed cost is subtracted, not just the supplier invoice. Then contribution margin, once every cost that scales with each sale — payment processing, shipping, fulfillment, a realistic allowance for returns — is stripped out. Then, finally, net profit, once the fixed costs of simply running the business are subtracted from what remains.
Brands that build this habit tend to run the numbers at two different speeds.
Weekly, at a blended level, mostly to catch anything drifting in the wrong direction early: a shipping rate creeping up, a return rate climbing, an ad platform quietly getting more expensive.
Monthly, at the individual product level, which is where the real decisions get made — what to keep pushing, what to reprice, what to quietly stop promoting even if it’s still selling well.
What tends to surprise founders the first time they build this view isn’t that their best-seller is unprofitable. That’s rare, and usually a sign something has gone seriously wrong upstream. What surprises them is that the ranking changes. The product that looked like the fourth or fifth most important item in the catalog, judged by revenue, is often sitting near the top once contribution margin becomes the measure. A lower-return, cheaper-to-ship product that never got marketing attention because it never had the flashy top-line number to earn it.
Meanwhile the hoodie, still a good product, still very much worth selling, turns out to be a product that needs a price increase, or a packaging redesign, or a harder look at why it keeps coming back. Not a product that deserves the disproportionate share of ad spend it’s been getting, simply because it’s the loudest number on the chart.
The Real Lesson
None of this means the hoodie is a failure. It doesn’t mean she made a mistake by getting excited when it started selling.
It means she’d been answering a different question than the one that actually determines whether a business gets to keep the money it earns.
Revenue is the applause. Contribution margin is what’s left in the register after everyone else — the factory, the freight forwarder, the ad platform, the payment processor, the customer who sent something back — has already been paid.
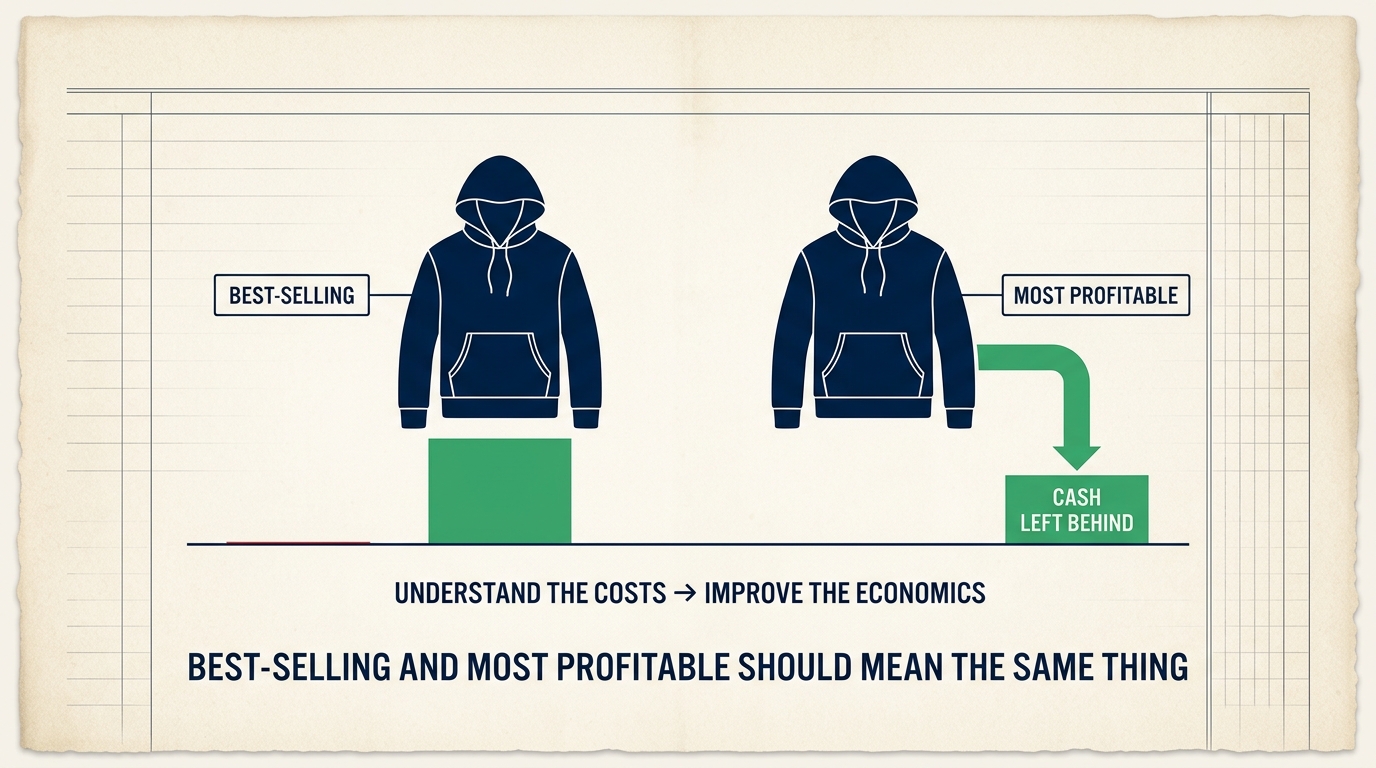
What sold the most and what made the most money are related questions. They are not the same question. The gap between them is exactly where a lot of growing Shopify businesses quietly lose the margin they thought they had. It shows up as tighter cash despite record sales. It shows up as a founder who can’t quite explain why growth doesn’t feel like growth. It shows up, most often, in a dashboard that’s technically accurate and functionally incomplete, not because anyone built it to mislead her, but because it was only ever asked to answer part of the story.
Successful Shopify founders don’t build their businesses around the products that sell the most.
They build them around the products that consistently leave cash behind after every real cost has been paid, and they make their hiring, inventory, pricing, and advertising decisions accordingly, product by product, instead of trusting a single number that was never designed to carry that much weight.
Sometimes the best-seller and the most valuable product turn out to be the same thing. The hoodie might even get there, once the pricing, the return rate, and the fulfillment cost are addressed with open eyes instead of assumptions.
But finding out requires asking the harder question first. Deliberately. Before the ad spend gets scaled and the inventory gets reordered and the international deal gets signed.
Because no dashboard is going to ask it for you.
You have to bring it to your own numbers, product by product, until “best-selling” and “most profitable” mean the same thing again.